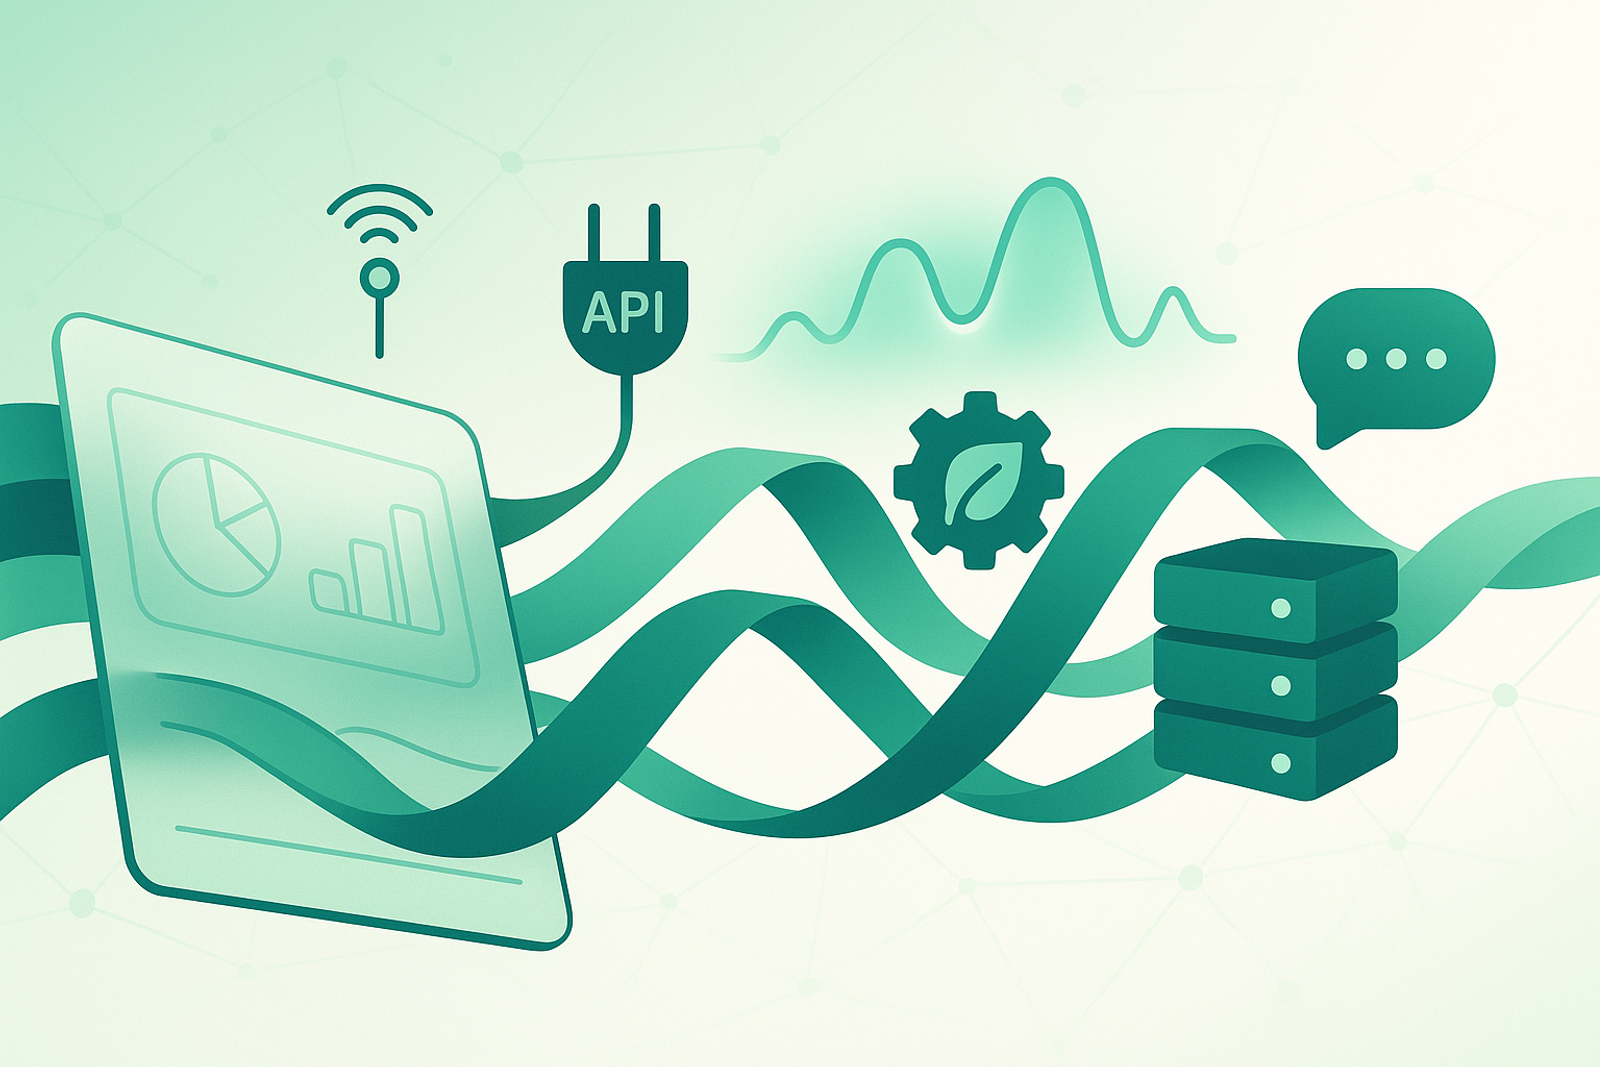
Why Emissions Monitoring Software Is More Than Just a Dashboard

Will Marshall
Thursday, June 12, 2025 • 4 min read
Dashboards are everywhere. They flash real-time metrics, paint pretty charts, and make any sustainability presentation look polished. But when it comes to managing your organisation’s carbon footprint, a dashboard alone is like the speedometer on a car without an engine: nice to look at, yet powerless to move you forwards.
Modern emissions monitoring software has evolved far beyond visual widgets. The best platforms weave data ingestion, automated calculations, compliance workflows and decision-support tools into a single engine that drives real-world decarbonisation.
In this article we’ll unpack what emissions monitoring software should and shouldn’t do, the hidden capabilities that separate eye-candy from impact, and why Emitrics is engineered to deliver more than pretty pictures.
1 Dashboards Are the Starting Line, Not the Finish
A clear visual of total tonnes CO₂e is vital, but on its own it answers only one question: “How big is the problem?” Effective climate action needs to answer at least four more:
Where are the hotspots?
What is causing them?
Which levers reduce them fastest?
How do we prove progress to auditors and stakeholders?
Any software that stops at step #1 leaves sustainability managers juggling spreadsheets the moment they need deeper answers.
2 Beyond Visuals: Five Capabilities to Demand
Automated Data Ingestion
Manual data entry slows teams and introduces errors.
Emitrics is developing connectors to Xero, Sage and expense systems to pull transactions nightly.
Smart Categorisation
Raw ledgers are meaningless without context.
Emitrics AI maps thousands of entries to GHG Protocol categories in seconds.
Factor Management & Refinement
Averages must evolve into supplier-specific precision.
Emitrics' built-in hierarchy lets you swap IO factors for supplier data with one click.
Actionable Insights & Alerts
Users need to know what to do next, not just what is.
Emitrics' hotspot alerts flag high-impact suppliers; scenario tools model reduction strategies.
Audit-Ready Reporting
CSRD, SECR and SBTi demand evidence, not screenshots.
The Emitrics version-controlled factor library, downloadable calculation logs, assurance-ready exports.
Without these back-office muscles, a dashboard becomes little more than corporate wallpaper.
3 Scope 3: The Litmus Test
Scope 3, purchased goods, services, logistics and more, typically makes up 70 %–90 % of a mid-market firm’s footprint. If your emissions monitoring tool can’t capture and improve Scope 3 data, it’s effectively hiding the majority of the picture.
Emitrics is designed Scope 3-first:
- Transaction-based footprinting converts spend into sector emissions on day one.
- Supplier-specific portal lets vendors upload verified factors, automatically replacing the averages.
- Confidence scoring shows which tonnes are rock-solid and which need refinement, so teams can prioritise supplier engagement.
Dashboards alone cannot deliver that nuance.
4 Turning Numbers into Decisions
Once hotspots are visible, operational leaders need guidance:
- Procurement may shift spend to a lower-carbon logistics firm.
- Facilities might model the ROI of a heat-pump retrofit.
- Finance wants to see carbon and cost side-by-side.
Emitrics embeds scenario modelling directly into the monitoring flow. Change an energy tariff or input a supplier’s renewable claim and watch updated totals cascade through every report—no external sheets or manual re-calcs required.
5 Regulation Demands Traceability, Not Graphics
Visual flair doesn’t satisfy auditors. Frameworks such as CSRD require disclosure of:
- Methodology and emission-factor sources
- Organisational boundaries
- Year-on-year comparability
Emitrics keeps an immutable log of every factor and calculation, timestamped and version-controlled. Reports export with full citations, making assurance far less stressful than hunting screenshots to prove your maths.
6 Checklist: Is Your Software More Than a Dashboard?
- □ Ingests financial, utility and supplier data automatically
- □ Uses AI or rules for granular categorisation
- □ Supports progressive factor refinement
- □ Offers scenario and reduction modelling tools
- □ Generates audit-ready methodology documentation
- □ Aligns with multiple frameworks (GHG Protocol, SBTi, CSRD)
- □ Provides configurable alerts and APIs for BI integration
If you’re missing more than two ticks, consider upgrading.
Conclusion
Emissions monitoring software should be the beating heart of corporate decarbonisation, collecting data, turning it into insight, triggering action, and proving progress. A visually stunning dashboard is helpful, but it’s only the surface. The power lies under the bonnet: automation, methodology, and decision-support.
Emitrics was built on that principle. Yes, our dashboards look great. But more importantly, we help every department, from sustainability to procurement, act on the numbers and meet compliance with confidence.
If you’re ready for emissions monitoring that delivers more than pretty charts, book a demo and see the engine in action.