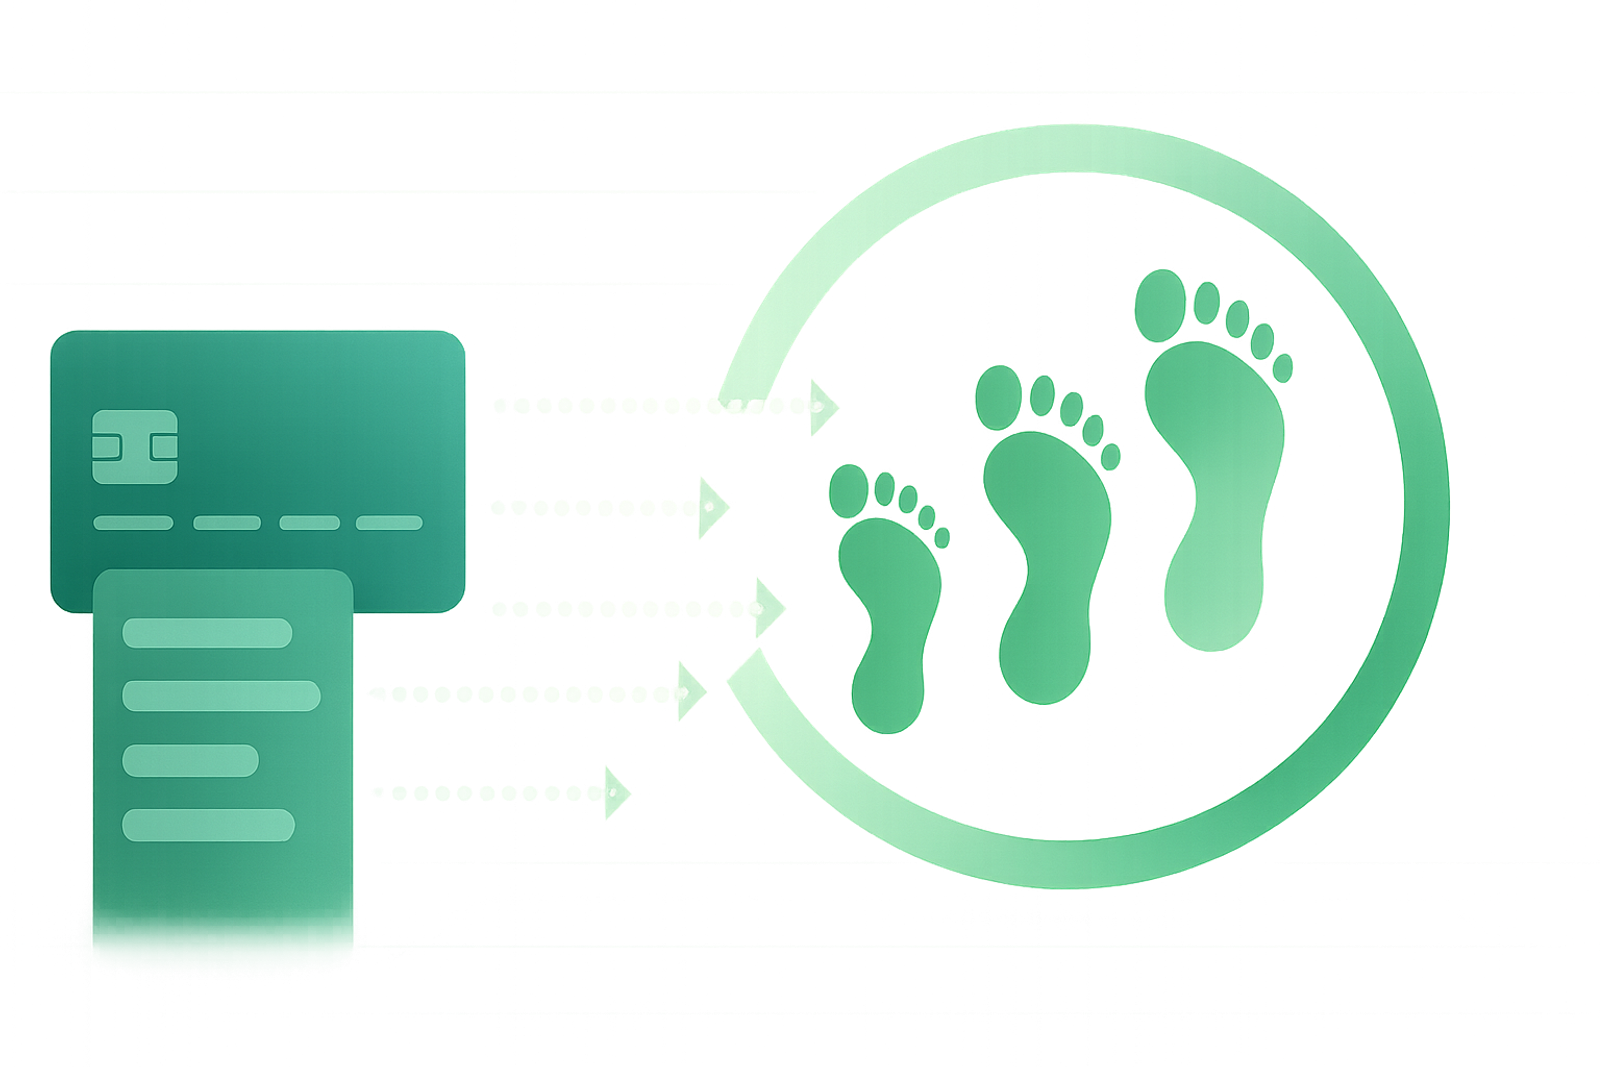
Financial Transaction Carbon Calculation: Turning Spend Data Into a Carbon Footprint

Will Marshall
Friday, June 20, 2025 • 4 min read
The quickest path to understanding your organisation’s climate impact may already live inside your accounting software. Financial‑transaction carbon calculation, sometimes called spend‑based or transaction‑based footprinting, takes the ledger you run every day and translates pounds spent into kilograms of CO₂‑equivalent.
Rather than chasing utility readings or supplier life‑cycle assessments from day one, you harness data that is systematic, audited and updated daily: your financial transactions. The result is a rapid, defensible baseline that shines a light on Scope 3 emissions and sets the stage for smarter, deeper decarbonisation.
Below, we unpack the nuts and bolts of the approach, its strengths and limitations, and how Emitrics turns raw spend into actionable carbon insight in a matter of hours.
1 What Is Financial‑Transaction Carbon Calculation?
The method maps each line of financial spend to an appropriate emissions factor expressed as kg CO₂e per pound (or dollar) spent. Multiply and sum, and you have the carbon footprint for that transaction, that supplier, that cost centre, and eventually the whole business.
A simplified example
- £12 000 paid to a cloud‑hosting provider
- Category: Data‑processing & hosting services
- EEIO factor: 0·38 kg CO₂e/£
- Emissions: 12 000 × 0·38 = 4 560 kg CO₂e
Do this across every purchase ledger, expense claim and supplier invoice, and you cover Scopes 1, 2 and the notoriously difficult Scope 3 Categories 1–9 without a single supplier survey.
The heavy lifting happens in three automated stages:
Data Ingestion – Pull transactions via accounting APIs (Xero, Sage, QuickBooks) or CSV.
Smart Categorisation – AI or rules engine maps spend to SIC/NAICS or custom emission categories.
Factor Application – Input‑output (IO) or bespoke factors scale spend into CO₂e, storing methodology transparently for auditors.
2 Why Use Spend Data? The Business Case
Advantage
Business Impact
Speed
Baseline footprint in hours, not quarters. Useful for board deadlines or first CSRD submission.
Breadth
Captures supply‑chain emissions that activity data often misses.
Cost Efficiency
Leverages data you already reconcile; no site audits or custom LCAs required.
Finance Alignment
Links carbon hotspots directly to budgets, making reduction initiatives tangible for CFOs.
For mid‑sized organisations with lean sustainability teams, transaction‑based calculation provides the 80 / 20 solution: maximum coverage with minimum hassle.
3 Common Concerns & How Emitrics Addresses Them
“It’s only an average.”True. Default factors reflect sector averages. Emitrics flags high‑impact categories and guides you to replace averages with supplier‑specific factors when they become available, without rewriting past data.
“What about price inflation?”Annual factor updates mitigate price effects, and you can lock factors per reporting year for comparability. Emitrics tracks versioning automatically.
“Auditors won’t accept spend‑based data.”The GHG Protocol explicitly permits spend‑based factors for Scope 3 Categories 1 & 2, provided sources and uncertainties are disclosed. Emitrics exports a full factor log for assurance reviews.
4 Inside Emitrics: Turning Transactions into Insight
Instant Scope 3 Coverage: Connect your ledger and hit Calculate. Within you’ll see which categories and suppliers dominate emissions, even if you have zero environmental data in‑house.
Confidence Scoring: Each transaction inherits a confidence rating, 5 for supplier‑specific factors, reducing for category averages and fallback assumptions,so you prioritise data‑quality improvements strategically.
Supplier Engagement Tools: Send templated requests to key vendors, inviting them to upload their own kg CO₂e/£ numbers. Approvals instantly override the default factor, shrinking uncertainty.
Budget‑Linked Hotspots: Because calculations start with spend, the dashboard shows £ and kg CO₂e side‑by‑side. That makes emission‑reduction conversations as concrete as cost‑saving ones.
5 Step‑by‑Step Implementation Roadmap
Baseline (Day 1) – Import last fiscal year’s transactions; generate initial footprint.
Hotspot Review (Week 1) – Identify top 10 spend categories driving 70 % of emissions.
Supplier Outreach (Months 1–3) – Target high‑impact suppliers for factor disclosure.
Policy Integration (Month 3) – Embed carbon intensity KPI into procurement scorecards.
Refinement Loop (Quarterly) – Refresh factors, compare YoY intensity, publish progress.
6 When to Augment Spend Data
Customer asks for product footprint?
Commission a targeted LCA for that SKU; ingest the product‑level factor.
Forthcoming audit of energy use?
Replace spend‑based electricity factor with metered kWh data.
Long‑term net‑zero target?
Gradually onboard suppliers to provide cradle‑to‑gate factors.
Financial transactions give you the map; supplier and activity data draw the finer contours.
Conclusion
Financial‑transaction carbon calculation bridges the gap between zero data and perfect data. It empowers companies to measure today, act tomorrow, refine next quarter. With Emitrics, that journey is automated, auditable and accessible to every department.
If your ledger closes each month, your carbon baseline is already waiting inside. Ready to unlock it? Book an Emitrics demo and turn spend into sustainable action.